Risk/reward planner
See what a trade has to pay before you take it — and the win rate your plan silently assumes.
1 : 2.40
Long
29.4%
+10.6 pts
+0.36R
≈ +36% of risk capital
Positive expectancy
The Practice Arena opens this exact setup on live prices with a virtual $10,000 account — same coin, same direction, same stop, same target. Every position you close is written into your journal, so the number you learn from is your own.
carries entry, stop and target
How to read the numbers
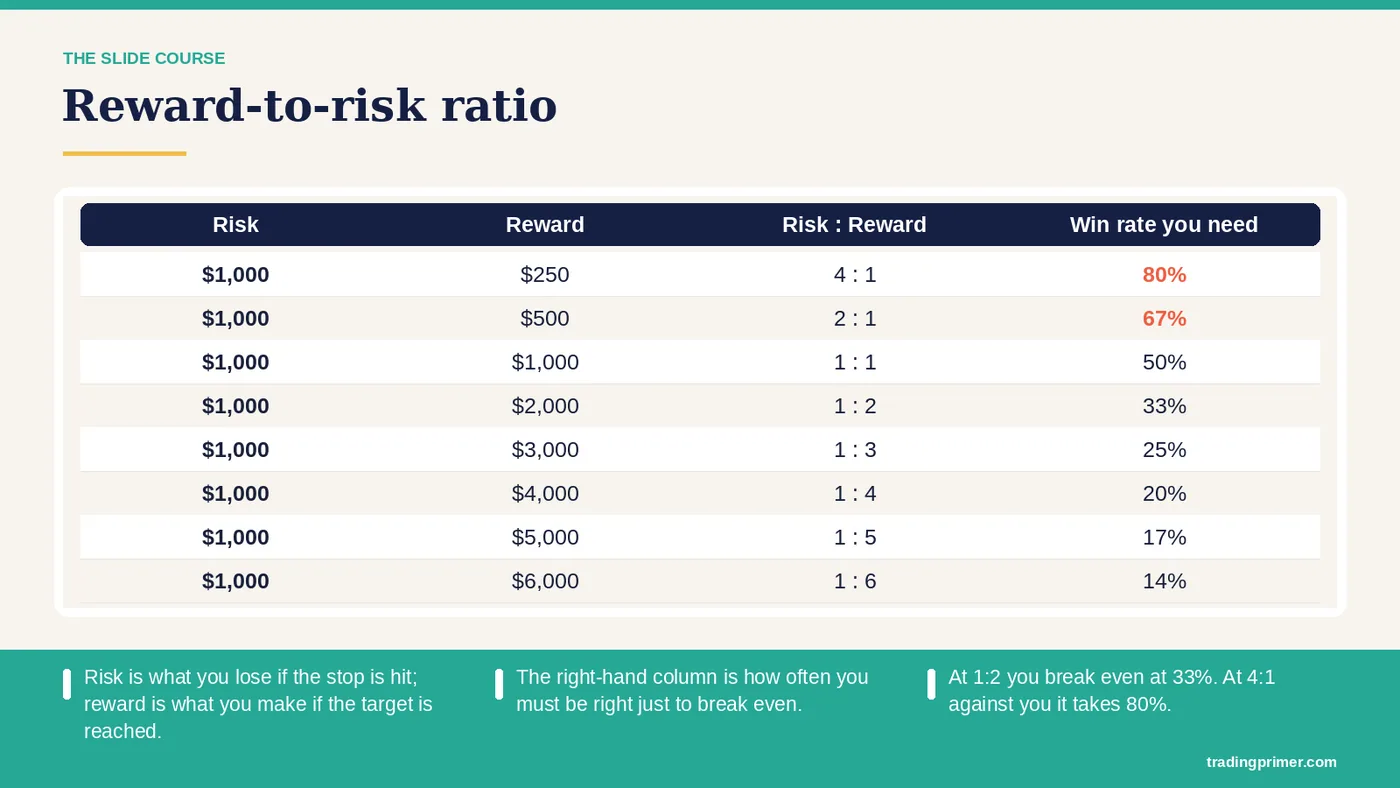
Risk:Reward compares the distance to your stop against the distance to your target. Break-even win rate = risk ÷ (risk + reward) — the accuracy your plan needs just to tread water, before fees. Expectancy combines your estimated win rate with the ratio: (win% × reward) − (loss% × risk), expressed in R — a +0.36R expectancy means that over many trades, each 1R you risk returns 0.36R on average.
| Ratio | Break-even win rate | Meaning |
|---|---|---|
| 1 : 1 | 50% | You must be right more often than wrong |
| 1 : 2 | 33.4% | Right 1 time in 3 is enough |
| 1 : 3 | 25% | Right 1 time in 4 is enough |
| 2 : 1 | 66.7% | You need elite accuracy — most plans like this fail |
Common mistakes
Trusting an estimated win rate you haven't measured. Until you have 50+ journaled trades, treat your win rate estimate as fiction and demand at least 1:2. Moving the target closer after entry — that quietly turns a 1:3 plan into 1:1 with a 1:3 win rate. Ignoring fees and slippage, which raise every break-even number, especially on lower timeframes.
A worked example — and the target that breaks it
Entry at $100, stop at $95, target at $112.50. Risk is $5 per unit, reward $12.50, so the ratio is 1 : 2.5 and the break-even win rate is 5 ÷ (5 + 12.5) = 28.6%. If your journal says you are right about 40% of the time on this kind of setup, expectancy is (0.40 × 2.5) − (0.60 × 1) = +0.40R per trade. Healthy.
Now look at the chart instead of the calculator. Suppose there is a clear resistance at $108 — a level price has turned from twice. A target above it is a wish. Move the target to $107.50, just under the level, and the same trade becomes $7.50 of reward against $5 of risk: 1 : 1.5, break-even 40%. At a 40% win rate the expectancy is now zero before fees. Nothing about the entry changed; the honest target removed the whole edge.
That is the main use of this planner: not to admire a big ratio, but to check whether the ratio survives putting the target where the market can actually reach. If it only works with the target beyond resistance, the answer is a better entry, closer to the stop — or no trade.
One caution on the win rate box: use the number from your own journal, not the one you hope for. With fewer than about 30 logged trades the estimate is too noisy to trust — plan with a conservative figure until the journal gives you a real one.