Drawdown recovery calculator
The most important asymmetry in trading: losses and gains are not symmetrical. See what any drawdown really costs.
+33.3%
$7,500
≈ 10 months
Serious — stop and review
The Practice Arena opens this exact setup on live prices with a virtual $10,000 account — same coin, same direction, same stop, same target — the arithmetic hurts less when the money is virtual. Every position you close is written into your journal, so the number you learn from is your own.
live prices · virtual money
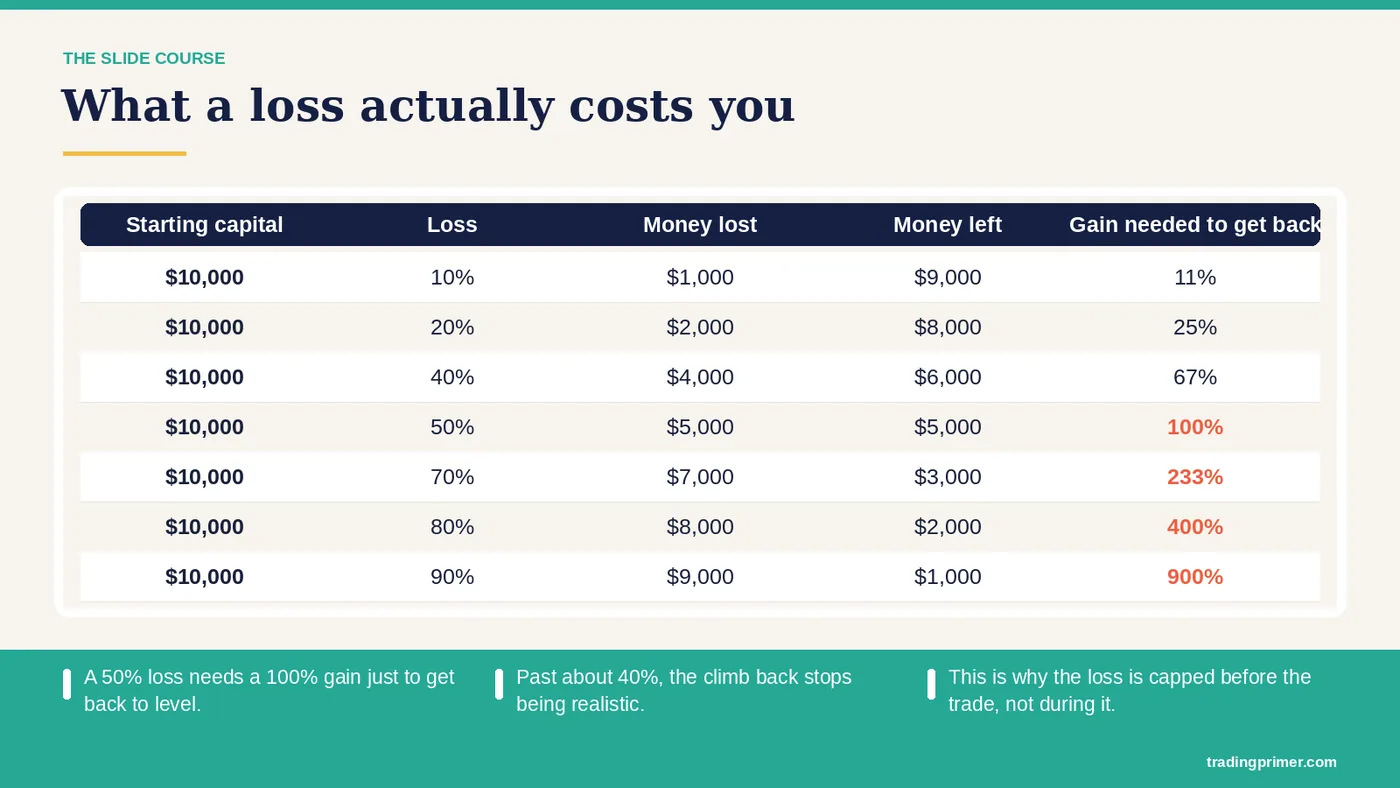
The full table — keep it where you can see it
| Drawdown | Required gain to recover | What it means in practice |
|---|---|---|
| 5% | +5.3% | Routine — normal cost of doing business |
| 10% | +11.1% | Manageable — review your last 10 trades |
| 20% | +25% | Serious — cut size in half until process is fixed |
| 30% | +42.9% | Program-threatening — stop trading, full review |
| 50% | +100% | You must double just to break even |
| 70% | +233% | Years of elite performance required |
| 90% | +900% | Effectively a restart, not a recovery |
Why this math rules everything
Recovery requirement = loss ÷ (1 − loss). The formula is convex: doubling your drawdown far more than doubles the climb back. This single equation is why professionals obsess over the size of each trade: at 1% risk per trade even a 10-loss streak digs a hole of barely 10% (+11% to recover), while at 10% risk the same streak leaves you needing +186%. The streak is the same; the sizing decides whether it's a bruise or a funeral.
It is also why "I'll win it back quickly" is the most expensive sentence in trading — the attempt to recover fast means bigger size, which means the next loss digs a disproportionately deeper hole. Drawdowns are escaped by process, patience and small, boring, repeated edges — never by one heroic trade.
Common mistakes
Averaging down to "lower the break-even". You're increasing size precisely when your account can least afford another loss. Doubling risk after losses (martingale) — the table above is the mathematical proof of why this ends one way. Not defining a maximum drawdown in advance — decide today the number at which you stop and review (many professionals use 20%), because you will not decide rationally while inside the hole.
A worked example: three bad months
An account of $10,000 loses 8%, then 12%, then 15% in three consecutive months. The losses add up to 35% on paper, but they compound: $10,000 → $9,200 → $8,096 → $6,882. The real drawdown is 31.2%, and getting back to $10,000 needs a gain of +45.3% — not 35%.
At a realistic 3% a month, that climb takes about 12.6 months. Three months to lose it, a year to earn it back, and that assumes the trader who just had three losing months starts producing steady gains the day the third month ends.
Now the same three months with one rule: after a 10% drawdown, risk per trade is cut in half until the account makes a new high. The second and third months, traded at half size, cost roughly half as much — about 6% and 7.5% instead of 12% and 15%. The account ends near $9,200 × 0.94 × 0.925 ≈ $8,000, a 20% drawdown needing +25% — about 7.5 months at the same pace. Same trader, same trades, five months less digging.
Write your two numbers down today, while you are calm: the drawdown at which risk is halved, and the drawdown at which trading stops for a full review. The risk of ruin simulator shows how often a given risk per trade reaches them.