Risk of ruin simulator
Your strategy doesn't have one future — it has thousands. This runs 1,000 of them and shows how many end in a blown account.
The Practice Arena opens this exact setup on live prices with a virtual $10,000 account — same coin, same direction, same stop, same target — the simulator says what happens over 100 trades; here you take the first one. Every position you close is written into your journal, so the number you learn from is your own.
live prices · virtual money
What this teaches that averages can't
Expectancy tells you the average future. Monte Carlo shows the distribution — and trading is survived in the distribution, not the average. The same 45%-win, 1:2 strategy is a completely different animal at different position sizes: try 1%, then 5%, then 10% risk and watch the ruin number. The strategy never changed. Only the sizing did.
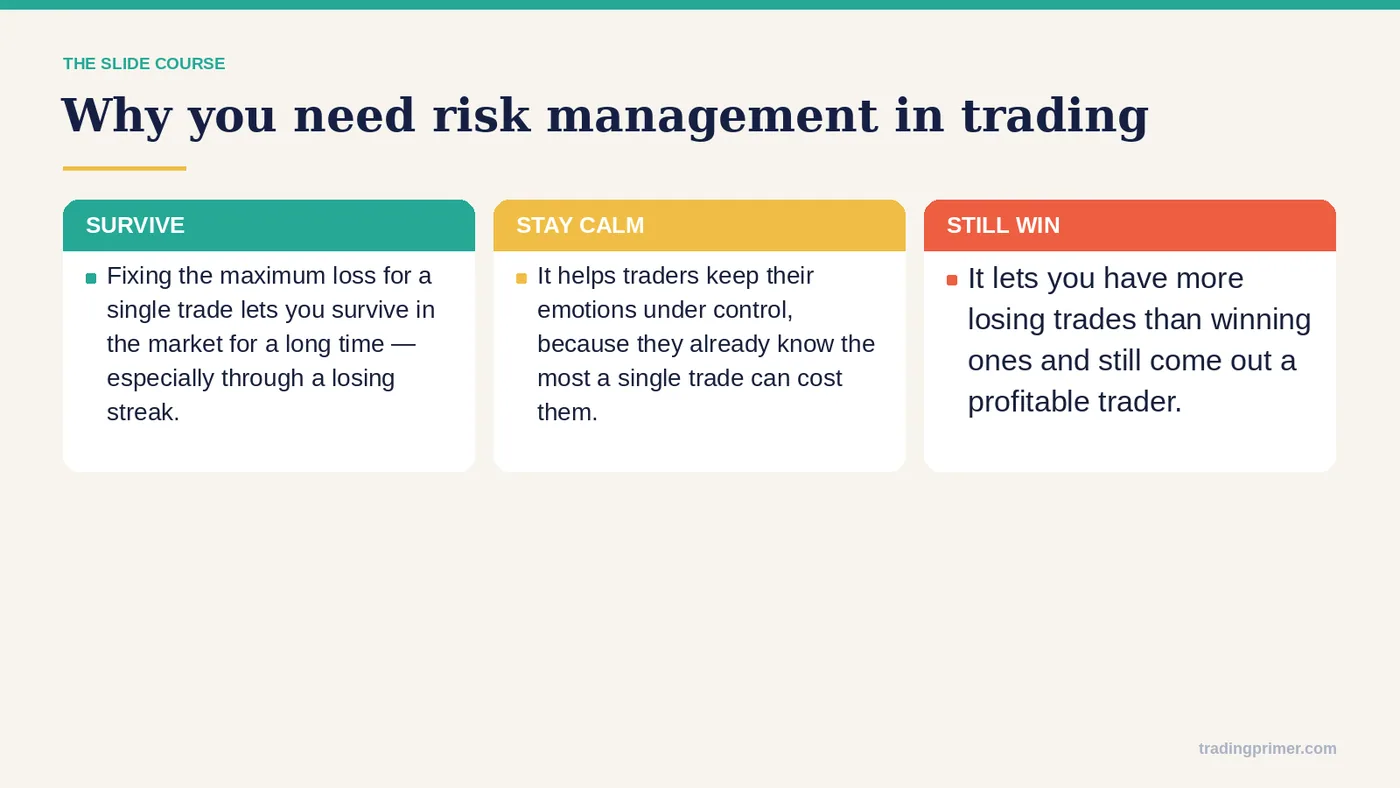
This is the mathematical reason every professional framework caps risk at 1–2%: not because pros are timid, but because ruin is an absorbing state — one visit and the game is over, no matter how good the strategy would have been afterwards. Log your real numbers in the trading journal, then feed your measured win rate and average R back into this simulator.
Common mistakes
Testing with a guessed win rate. Until you have 50+ journaled trades, your "60% win rate" is a feeling, not a number — simulate 10 points lower to be honest. Ignoring the drawdown line: a strategy can end profitable AND pass through a −40% drawdown you would never psychologically survive — check median max drawdown against the recovery math. Assuming independence saves you: real losses cluster (news, regime shifts), so real ruin odds are slightly worse than simulated.
What risk per trade does to the same strategy
We ran the simulator’s logic at a much larger scale — 100,000 paths of 200 trades each, ruin meaning the account touches half its starting balance — on two strategies. Your own 1,000-path runs above will land close to these numbers, not exactly on them.
A thin edge: 40% winners at 1 : 1.6. Expectancy is only +0.04R per trade — realistic for many discretionary traders once fees are paid.
| Risk per trade | Chance of ruin | Median worst drawdown |
|---|---|---|
| 1% | ≈ 0% | ≈ 16% |
| 2% | ≈ 3% | ≈ 30% |
| 5% | ≈ 41% | ≈ 62% |
Same strategy, same win rate, same ratio. At 5% per trade, roughly two traders in five lose half the account even though every one of them has a positive edge — and the typical one still lives through a 62% drawdown on the way.
A good edge: 45% winners at 1 : 2 (+0.35R per trade). At 1% risk, ruin is effectively zero and the median worst drawdown is about 9%. At 5% it is about 1.5% ruin with a 40% median drawdown; at 10% about one path in six is ruined. A better strategy buys you room, not immunity.
The practical reading: pick the risk per trade at which the bad paths are survivable, not the one at which the median path looks exciting. For most people that is 1%, sized with the position size calculator.